PROJECT PROGRESS & DASHBOARDS
See progress. Understand performance.
Bring schedules, hours, and financial performance into the same conversation. Follow one project in detail, compare projects side by side, and see what completed work tells you about your business.
Start Free60-day free trial. All features included.
01 · Project Indicator
Understand the schedule, tasks, hours, and finances of one project.
02 · Project-specific Key Figures
Compare projects in a consistent view and identify deviations.
03 · Organizational Dashboard
Review delivery performance, cost discipline, and profitability across projects.
PROJECT INDICATOR
The whole project picture, in one place.
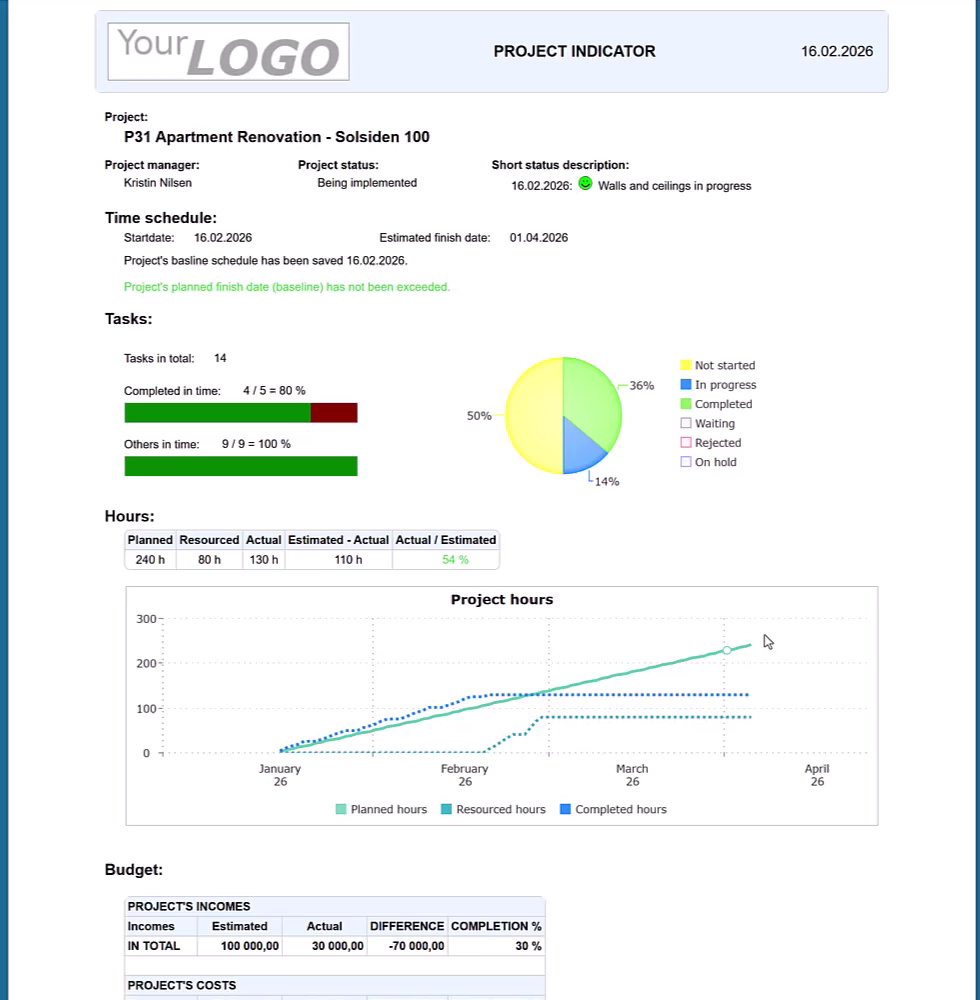
Go beyond a completion percentage. The Project Indicator combines the project manager’s status description with schedule, task, hour, and budget information, so you can decide what to investigate next.
Schedule and task progress
Review start and estimated finish dates alongside the saved baseline. See task status distribution, how many completed tasks finished on time, and whether the other tasks are within their planned dates.
Planned, resourced, and actual hours
Compare the estimate with allocated resources and reported time. Review the difference and follow cumulative planned, resourced, and completed hours.
Income, costs, and margin
Compare estimated and actual figures for income, labor, materials, purchased services, and other costs. See how deviations affect margin and margin percentage.
Trends that explain the totals
Use cumulative hours, income, and cost charts to understand how the project is developing. Investigate deviations while there is still time to respond.
A finish date that has not yet passed is one part of the picture. Review remaining work, hours, and financial figures together before deciding whether the project needs attention.
PROJECT-SPECIFIC KEY FIGURES
Compare projects. Find the exceptions.
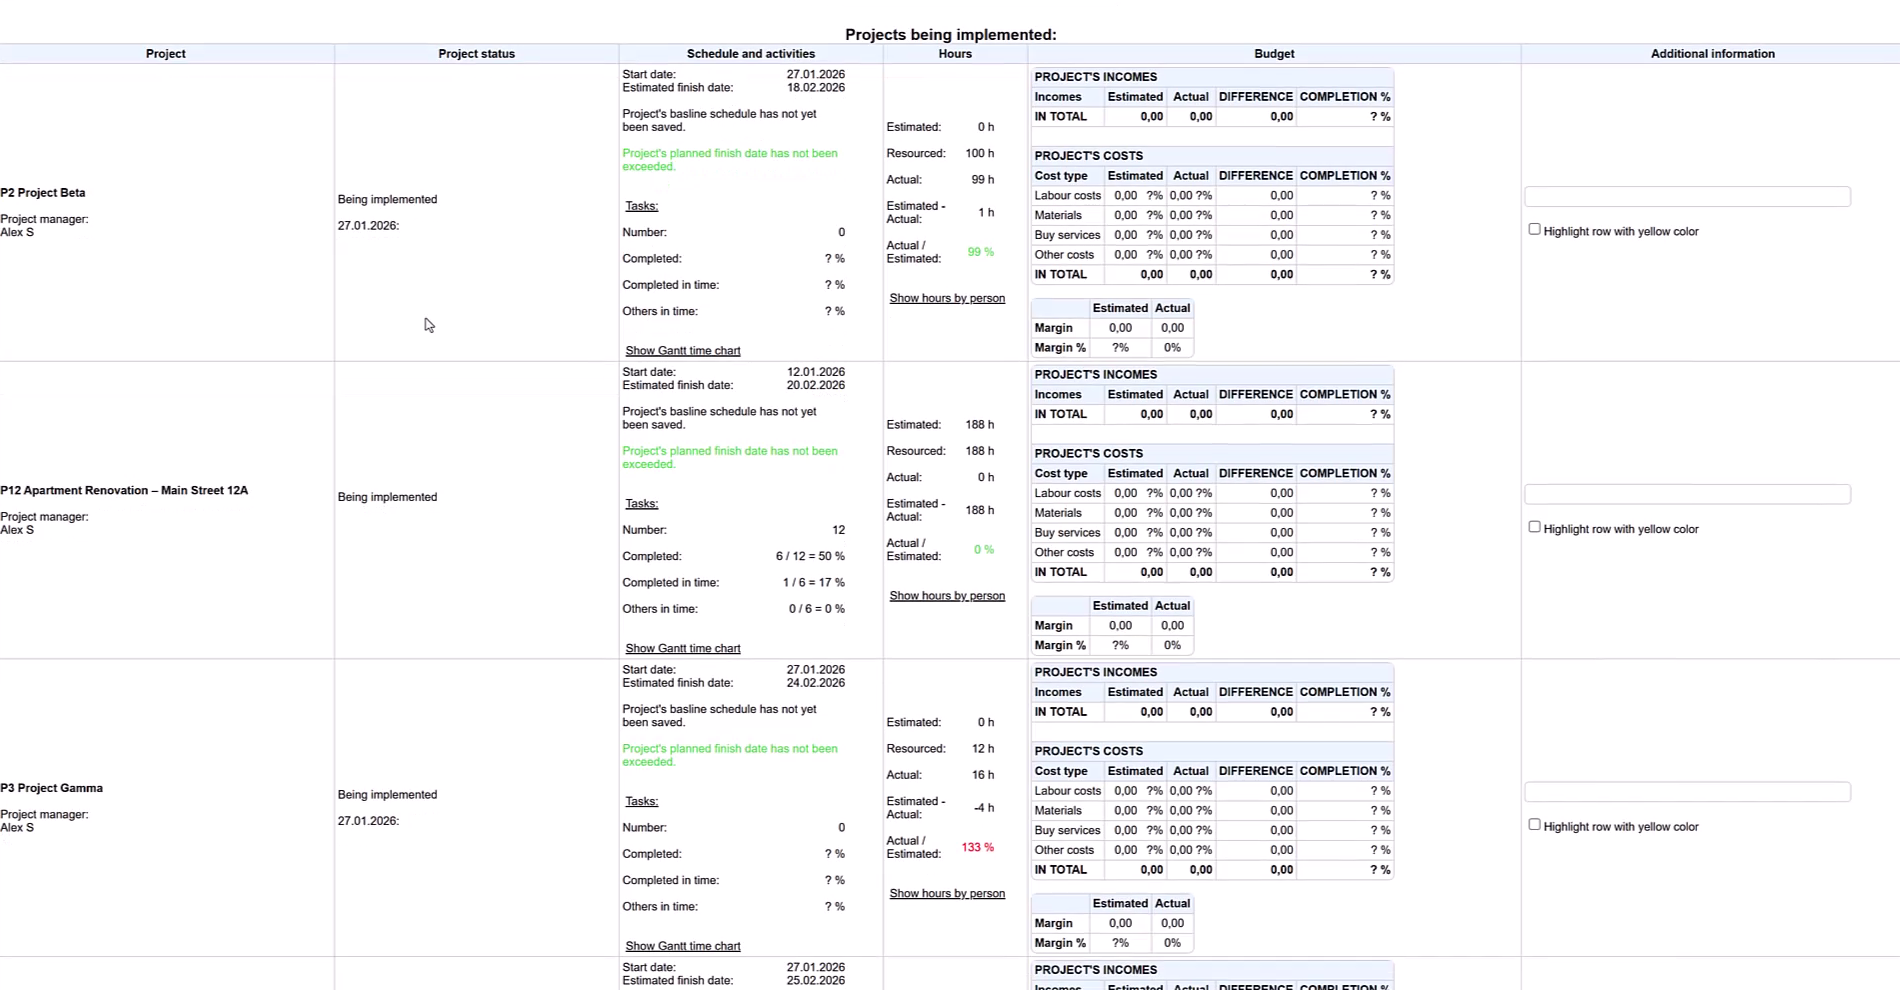
Review ongoing projects side by side with the same information for each one: project status, schedule and activities, hours, budget, and additional information.
Compare like with like
Use a consistent structure to review task performance, estimated and actual hours, income, costs, and margins across projects.
Keep attention on the right rows
Highlight a project row in yellow when it needs follow-up, and add supporting information for the next review.
Move from figures to detail
Open the project’s Gantt chart or hours by person to investigate the reasons behind a deviation.
ORGANIZATIONAL DASHBOARD
Learn from delivery across the business.
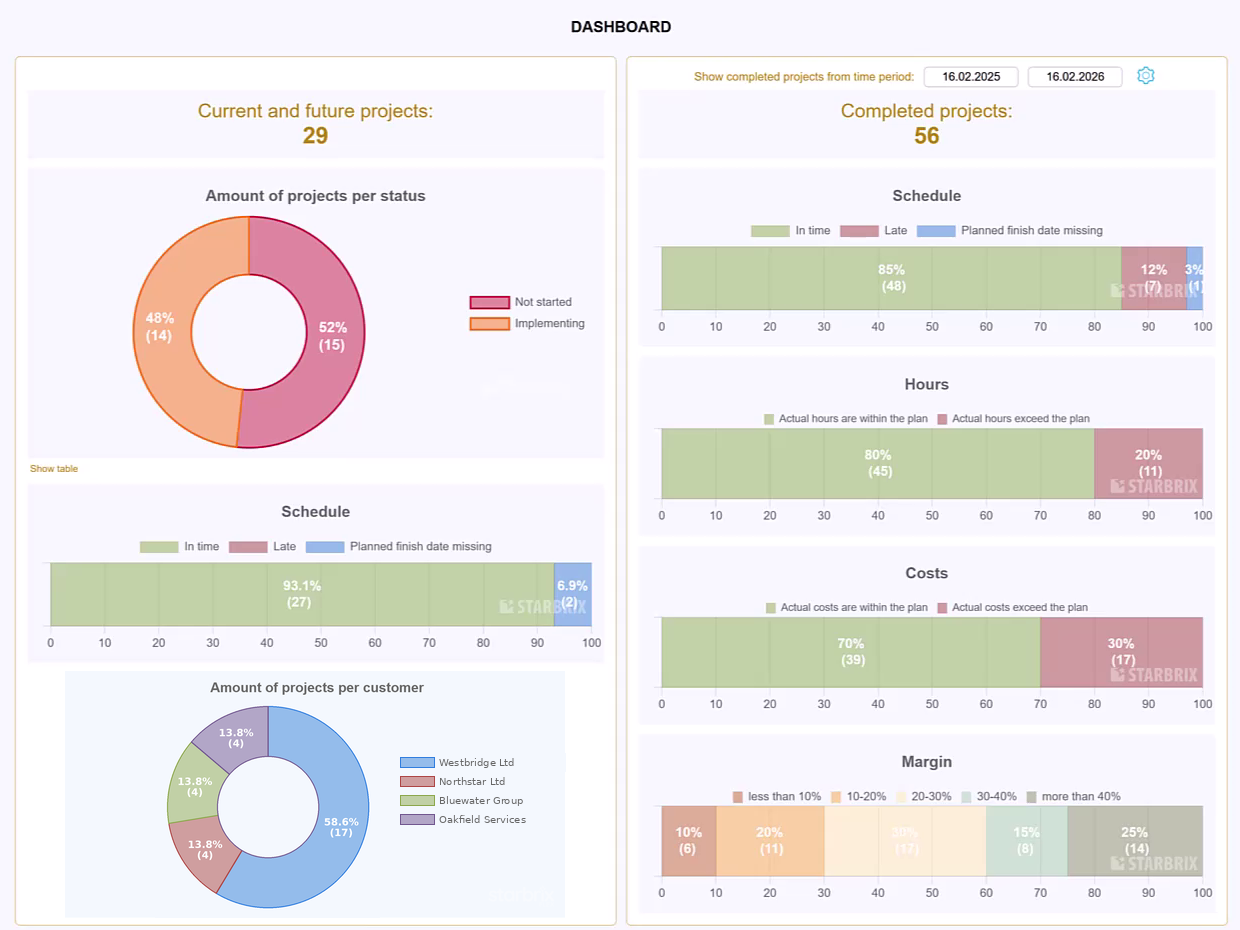
Separate the situation in current and future projects from the results of completed work. Use the dashboard to see patterns that are harder to spot in individual projects.
Current and future projects
See the number of projects, their distribution by project status and customer, and schedule information—including projects without a planned finish date.
Completed projects
Choose a completion date range. Review on-time delivery, hours and costs within or above plan, margin distribution, and how completed projects are distributed across customers.
Use these results to guide realistic estimates, follow-up priorities, and improvements in future projects. The value of the dashboard depends on keeping project dates, hours, and financial information up to date.
FREQUENTLY ASKED QUESTIONS
Project follow-up in Starbrix Flex.
What does the Project Indicator show?
It brings together project status, a short status description, schedule and baseline information, task status, hours, and estimated versus actual financial figures for one project.
Can I compare planned and actual hours?
Yes. Review planned, resourced, and actual hours, the remaining difference, and actual hours as a percentage of the estimate. The cumulative hours chart helps you see how the figures develop over time.
Can I follow project costs and profitability?
Yes. Compare estimated and actual income, labor costs, materials, purchased services, and other costs. Review differences, margin, margin percentage, and cumulative income and cost trends.
Can I compare several projects in one view?
Yes. Project-specific Key Figures puts projects side by side with status, schedule and task information, hours, and budget figures. Highlight rows that need attention and open the Gantt chart or hours by person for more detail.
What does the Organizational Dashboard show?
It summarizes current and future projects by status, schedule, and customer. For completed projects, it shows schedule performance, hours and costs against plan, margin distribution, and the distribution of projects across customers.
Can I review completed projects for a specific period?
Yes. Select a completion date range in the Organizational Dashboard to review completed projects for that period.
Can I try these features for free?
Yes. Starbrix Flex offers a 60-day free trial with all features included.
Turn project information into better decisions.
Understand the details. Compare performance. Keep your next action clear.
Start Free60-day free trial. All features included.