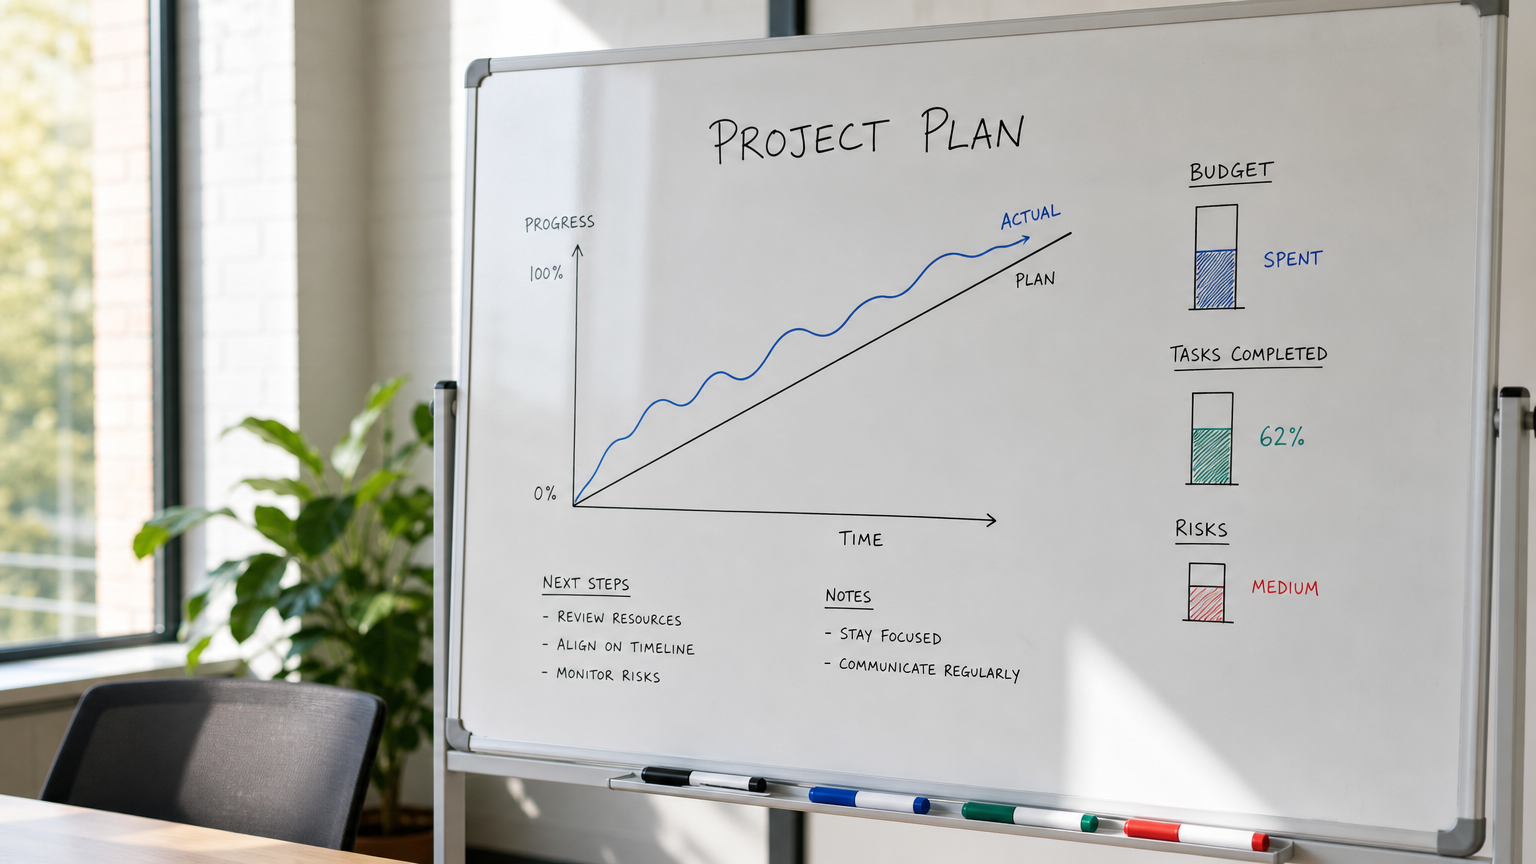
Project financial management is not just about creating a budget.
The real challenge is keeping the financial plan connected to what is actually happening in the project. How much income was expected? When was it expected? Which costs were planned? What has already been ordered? What has actually been realized? How much labor has been consumed? Is the project still performing against its approved budget? And what does all of this mean for margin and future cash flow?
This guide compares Starbrix, monday.com, and Smartsheet specifically from that perspective.
It is not a general project management comparison. The focus is on how each platform connects project planning, time, costs, income, actuals, approved baselines, cash flow, and portfolio-level financial visibility.
What project financial management means in this comparison
For this comparison, project financial management covers seven closely related capabilities:
- Budget planning: planning project income, costs, labor, materials, and services.
- Actual cost and income tracking: recording what has actually been realized.
- Time-to-cost conversion: turning reported work into project labor costs.
- Committed costs: identifying costs that have already been ordered but may not yet appear in accounting.
- Baseline and variance control: preserving an approved financial plan and comparing actual performance against it.
- Cash flow forecasting: understanding when planned income and expenditure are expected to occur.
- Financial rollups: aggregating financial information from tasks to projects and across project portfolios.
The three platforms approach these requirements differently.
Three different approaches to project finance
Starbrix treats project finance as an integrated part of project execution. Budgets can be created at project or task level, income and costs can be planned over time, reported hours can automatically generate labor costs, planned materials and services can feed the budget, purchase orders can create committed costs, and accounting integrations can bring actual income and costs back into the project.
Approved costs and hours can be saved as baselines, allowing actual performance to be compared against the approved plan even if estimates later change. Because planned income and expenditure can be connected to dates, the same project data can also generate visual cash flow forecasts.
Financial information can then be aggregated across projects, umbrella projects, operational areas, customers, users, and the company-wide project portfolio.
monday.com takes a configurable Work OS approach. Its current project boards include project-specific fields such as Budget, Planned Effort and Effort Spent, while cost management can be built using Numbers Columns, cost categories, charts, formulas, and dashboards. Its portfolio solution can consolidate project budgets and planned-versus-spent effort across connected projects.
Smartsheet, particularly through Resource Management, provides structured functionality for project budgets, resource planning, time tracking, expenses, approvals, and reporting. Budget reports can compare incurred and remaining amounts with the project budget in hours, days, or monetary amounts.
The main difference is therefore not whether the three platforms can display financial numbers. It is how deeply the financial data is connected to the operational project model and where those numbers originate.
Feature-by-feature comparison
monday.com's current documentation confirms built-in project Budget fields and portfolio dashboards that consolidate budget and planned-versus-spent information, while its broader budget workflow remains highly configurable through Numbers Columns, formulas, charts, and dashboards. Smartsheet's Resource Management documentation confirms budget reporting with incurred, future scheduled, budget, and remaining values, as well as configurable time/expense approval and locking.
How each platform models a project budget
Starbrix: budget the way the project is actually structured
Starbrix supports both simple and detailed budgeting.
For a straightforward project, the project manager can enter estimated income and estimated costs directly on the project. Costs can be divided into as many as 30 cost types, such as:
- Labor costs
- Materials
- Purchased services
- Other costs
A cost can be entered directly as an amount or calculated from quantity × unit price.
Income and costs can also be connected to expected dates. If a payment or cost is expected to occur in several stages, it can be divided into partial payments with different dates.
This turns the budget from a static total into a time-phased financial plan.
For more complex projects, Starbrix can go further. Instead of entering only totals, individual estimated income and cost entries can be created. Each entry can represent a specific expected invoice, payment, purchase, service, or other financial event.
Budgeting at project and task level
A distinctive part of the Starbrix model is that budgeting does not have to stop at project level.
Income and costs can also be planned on individual tasks. Those task budgets are automatically aggregated into the project.
A company can therefore choose among three approaches:
Project-level budgeting for a simple financial plan.
Task-level budgeting when income and costs belong to identifiable parts of the project.
A combination of both, where task-specific income and costs are budgeted on tasks while general project costs remain at project level.
Because Starbrix tasks can contain subtasks, financial planning can follow the task hierarchy further down when necessary. In practice, budgeting at the first task level is often sufficient.
This allows both top-down and bottom-up budgeting without forcing every project into the same financial structure.
monday.com: configurable financial tracking
monday.com combines built-in project fields with configurable board structures. Current project boards include fields such as Budget, Planned Effort, and Effort Spent. Cost management can then be extended using Numbers Columns for expenses, Dropdown Columns for cost types, formulas, and charts comparing expenses with approved budgets.
This provides considerable flexibility because organizations can design financial workflows around their own board structures.
The trade-off is that much of the financial model is determined by the configuration of the workspace. The relationship between budget, expenses, tasks, formulas, and dashboards therefore depends on how the solution has been designed.
Smartsheet: structured budgets through Resource Management
Smartsheet Resource Management treats budgets as part of its resource and project management model.
Its budget reports show the project's budget together with incurred amounts, future scheduled amounts, and the remaining budget. Reports can be viewed in hours, days, or monetary amounts.
Its strength is the close relationship between resource planning, time tracking, expenses, and project budgets.
Planned income and actual income
Project finance is not only about costs.
Starbrix allows expected project income to be planned in the same financial structure as costs.
A simple project might have one expected income amount. A more detailed project could contain several planned income entries, for example:
First milestone payment – €30,000 – October
Second milestone payment – €40,000 – December
Final payment – €20,000 – February
Actual income is recorded separately.
Depending on the organization's process, actual income can be entered manually, generated through Starbrix invoicing, or imported from an accounting system.
This gives the project manager a direct comparison between what was expected and what has actually been realized.
Cost tracking: from budget to operational reality
Starbrix applies the same principle to costs.
Estimated costs can be entered as individual rows with a date, amount, description, and cost type. Actual costs can then be entered manually or received from integrated financial systems.
But Starbrix can also generate project costs from the operational work itself.
Reported time can automatically become labor cost
Every Starbrix user can have an hourly cost.
If a person with an hourly cost of €50 reports 10 hours to a project, Starbrix can generate:
10 hours × €50 = €500 labor cost
The cost is already associated with the correct project or task because the time entry itself was reported there.
This eliminates the need to recreate the same labor cost manually in a separate financial layer inside the project.
Organizations that prefer to receive payroll or labor costs from an external payroll or accounting system can use that approach instead. The source can therefore be selected to fit the organization's financial process and avoid double counting.
Materials and services can feed the budget automatically
Materials and services used in project planning can also carry standard costs.
When they are planned for a project, those costs can automatically become part of the project budget under the appropriate cost type.
When actual consumption or delivery is recorded, the corresponding actual cost can also be reflected in the project.
Again, organizations can decide whether operational data in Starbrix or accounting data should be the source for actual costs.
This is an important distinction from maintaining a separate spreadsheet budget: the financial plan can be generated partly by the same operational planning that defines how the project will actually be executed.
Estimated, Ordered, and Actual: seeing committed costs earlier
One of the most useful distinctions in project cost control is the difference between money that has been budgeted, money that has already been committed, and money that has reached accounting.
Starbrix can represent these as:
Estimated → Ordered → Actual
When materials or services are purchased through Starbrix purchase orders, the project manager can see how much has already been ordered.
This matters because accounting information naturally arrives later.
A project may have committed €100,000 through purchase orders while only €40,000 has reached the accounting system so far. Looking only at accounting actuals could therefore give the impression that considerably more budget remains available than is really the case.
The Ordered value provides earlier visibility.
Purchase orders can contain items for one project or several different projects. Starbrix associates the relevant purchase-order lines with the corresponding projects, so each project sees its own committed purchases.
Organizations can also choose whether purchases should immediately be treated as actual costs or remain in the separate Ordered category until the accounting entries arrive.
Approved budgets and baselines
A budget changes during the life of a project. That creates an important governance problem: if the current estimate is continuously updated, what should actual performance be compared against?
Starbrix addresses this by allowing approved project costs to be saved as a baseline.
Approved planned hours can likewise be saved as a baseline.
The baseline preserves the approved plan even when estimates are subsequently revised as the project develops. Actual costs and reported hours can then be compared against that stable reference point.
This creates an important distinction between:
Approved baseline → Current estimate → Actual outcome
A project manager can therefore see not only where the project stands today, but also how it is performing against what was formally approved.
Budget vs. actual and project margin
Starbrix summarizes project finances into a budget-versus-actual view.
For income and each cost type, the project manager can see:
- Estimated
- Actual
- Difference
- Completion percentage
The system also calculates Estimated Margin and Actual Margin, both as amounts and percentages.
This means that the project manager is not limited to asking whether costs are above budget. The financial picture also shows whether the project's expected profitability is actually being achieved.
Together with the baseline, this provides several useful reference points: the originally approved cost level, the current estimate, and the actual financial outcome.
Seeing financial development over time
Totals tell only part of the story.
Starbrix can visualize estimated and actual income and costs over time, for example by week or month.
The project manager can view both periodic and cumulative development.
This creates two complementary perspectives:
The financial table answers: Where are we now?
The graphs answer: How did we get here, and how is the financial development changing over time?
A project can also be followed financially even when only part of the budget has been planned. For example, expected income may have been budgeted while actual costs are continuously imported from accounting.
From dated budgets to cash flow forecasts
Once planned income and expenditure are connected to dates, the same information can answer another critical management question:
When is money expected to come in, and when is it expected to go out?
Starbrix uses the dated income and cost information already budgeted in projects to generate cash flow forecasts.
This means that cash flow forecasting is not maintained as a separate parallel forecast. It is derived from the financial plans of the underlying projects.
The forecast can be presented through both tables and visual graphs, making it possible to see expected inflows and outflows over time.
At project level, this gives the project manager a forward-looking view of the project's expected cash movement rather than only its total budget and expected margin.
But the same principle also works above the individual project.
Cash flow across operational areas and the entire company
Because project financial information can be aggregated, Starbrix can generate cash flow forecasts for:
An individual project
An operational area
The company as a whole
For example, if an operational area contains 20 projects with dated expected customer payments and planned expenditure, Starbrix can combine those project plans into a consolidated cash flow forecast for that business area.
At company level, the dated budgets from the project portfolio can similarly provide a forward-looking view of expected project-related cash inflows and outflows across the organization.
This is an important distinction between profitability and liquidity.
A project may show a healthy expected margin while still having periods where major expenditure occurs before the corresponding customer payments arrive. A time-based cash flow forecast makes that timing visible.
From task economics to portfolio economics
Financial management becomes substantially more useful when the same data can be aggregated without rebuilding it in spreadsheets.
Starbrix can roll financial information upward from tasks into projects.
But the aggregation does not stop there.
Umbrella projects
Several ordinary projects can be connected to an umbrella project representing a larger initiative.
Each underlying project retains its own planning, tasks, project manager, budget, and financial tracking, while the umbrella project provides a combined financial picture of the entire initiative.
This is useful when a larger delivery, program, or strategic initiative consists of several separate projects that still need to be managed independently.
Company-wide project portfolio
Starbrix maintains a project portfolio containing the organization's current, upcoming, and completed projects.
Portfolio financial views can show each project as a row with information such as:
- Estimated and actual income
- Estimated and actual costs
- Variances
- Planned and reported hours
- Estimated and actual margin
The view can be restricted to a selected period, and completed-project history can be included as far back as required.
This makes historical project finance part of the same environment as current project control.
Operational areas and workspaces
Projects can also be grouped into project portfolios representing different parts of the organization.
In Starbrix Flex these are called operational areas; in Starbrix Core they are called workspaces.
An organization might create separate portfolios for different business areas, product groups, regions, or types of delivery.
The same financial view can then answer questions such as:
How are all projects in this business area performing financially?
And because dated budget information can also be aggregated, an operational area can have its own cash flow forecast, not merely a total budget.
Financial views by user and customer
The same principle applies from other perspectives.
Individual users can see the combined financial picture of projects in which they participate or act as project manager.
Customer views can show the finances of all projects carried out for a particular customer.
The same underlying project data can therefore be analyzed through several perspectives:
Task → Project → Umbrella project
and across:
Company → Operational area/workspace → Customer → Project manager/user
The financial information does not have to be reconstructed for each reporting perspective.
Portfolio reporting in monday.com and Smartsheet
monday.com also provides portfolio-level reporting. Its All Projects Dashboard automatically gathers data from connected projects and includes preconfigured views of metrics such as project budgets and planned-versus-spent effort. Its current portfolio solution can support up to 200 project boards in that dashboard.
The approach remains configurable: boards, columns, formulas, widgets, and dashboards determine how financial information is structured and presented. monday.com's broader dashboard functionality can aggregate numerical data across connected boards and automatically update as board data changes.
Smartsheet Resource Management provides cross-project reporting from a resource-management perspective. Reports can be grouped and filtered by dimensions such as client, project, team member, and custom project fields. Its budget reports provide incurred, future scheduled, budget, and remaining values.
All three platforms therefore provide ways to move beyond a single project, but they arrive there through different data models.
Approvals, baselines, and financial controls
Smartsheet has a particularly explicit approval model for time and expenses. Resource Management can enable approval workflows for time and expenses and can lock entries upon approval. Organizations can also control whether approved hours are used as incurred time or fees.
monday.com can build approval-style processes through its workflow and automation capabilities, while financial controls depend more heavily on how the board and workflow have been configured.
Starbrix includes review and approval workflows for time reporting and also supports financial baselines. Once project costs have been reviewed and approved, the approved cost budget can be saved as a baseline. In the same way, approved planned hours can be saved as a baseline. This preserves the approved plan even if estimates are later revised as the project progresses.
Actual costs and reported hours can then be compared against these approved baselines, giving project managers a stable reference point for variance tracking. This separates the approved commitment from the current forecast and actual outcome, making it possible to see not only where the project stands today, but also how it is performing against what was formally approved.
These are somewhat different approaches to financial control. Smartsheet emphasizes approval and locking of individual time and expense entries, while Starbrix also emphasizes preserving the approved project plan itself as a reference point for subsequent performance.
Accounting and financial-system integrations
Project management software should not necessarily try to become the accounting system.
A more useful model is often to let accounting remain the financial system of record while bringing the relevant actuals back into the project environment.
Starbrix supports this model.
Actual project income and costs can be exchanged with accounting systems through APIs and integrations. Starbrix has implemented integrations with systems including Visma, Netvisor, Procountor, Fennoa, Lemonsoft, and Fortnox, as well as custom integrations for other systems.
Its open integration model also allows additional system-specific integrations to be developed when required.
This enables a project manager to work with operational project information and accounting actuals in the same project-finance view without attempting to replace the company's accounting system.
monday.com supports external data through integrations and APIs, and its dashboards can surface external information after it has been brought into board columns through imports, sync integrations, or API connections.
Smartsheet Resource Management data can likewise be analyzed further through Smartsheet's reporting environment and broader integration capabilities.
The important evaluation question is therefore not simply:
Does it integrate?
It is:
Which system owns each number, how quickly does it arrive, and how does it become associated with the correct project?
Where the three approaches differ most
The clearest difference is the underlying philosophy.
Starbrix connects financial control directly to project execution. Time entries can create labor costs. Materials and services can create planned and actual costs. Purchase orders can expose committed costs before accounting receives the invoice. Approved budgets and hours can be frozen as baselines. Dated income and costs can generate cash flow forecasts. Accounting integrations can bring financial actuals back into the project. The resulting information can then be aggregated from tasks through projects and across multiple portfolio perspectives.
monday.com emphasizes configurability. Its project boards now include structured project fields such as Budget, Planned Effort, and Effort Spent, while Numbers Columns, formulas, automations, charts, and dashboards provide additional building blocks for financial workflows. Portfolio dashboards extend this across projects.
Smartsheet Resource Management emphasizes resource economics and financial control. Its strengths include structured project budgets, resource scheduling, time and expense tracking, approval workflows, and budget reporting with incurred, scheduled, and remaining amounts.
The practical choice therefore depends on what an organization expects project financial management to do.
Questions to ask when evaluating project finance software
Instead of simply asking whether a system has a "budget feature," test how it handles a real project.
Can income as well as costs be planned? Can the financial plan be distributed over time? Can costs be separated into meaningful cost types? Can budgets be created at task level and rolled up automatically? Does reported time automatically affect project cost? Can planned materials and services feed the budget? Can the project manager see committed purchases before invoices reach accounting? Can the approved budget be frozen as a baseline while forecasts continue to evolve? Can actual performance be compared against that approved baseline? Can actual income and costs arrive automatically from accounting? Can estimated and actual margin be compared? Can dated project budgets automatically produce a cash flow forecast? And can the same financial information be aggregated across a customer, business area, program, project manager, or the entire project portfolio?
These questions expose the difference between displaying budget numbers and actually managing project economics.
Frequently asked questions
Can Starbrix track budget versus actual without Excel?
Yes. Starbrix provides native estimated-versus-actual project financial views for income and costs, including differences, completion percentages, cost-type breakdowns, and estimated versus actual margin. Financial development can also be visualized over time.
Can Starbrix budget at task level?
Yes. Income and costs can be budgeted at project level, task level, or as a combination. Task-level figures roll up into the project.
Can Starbrix preserve the originally approved budget?
Yes. Approved project costs can be saved as a baseline. Approved planned hours can also be baselined. Actual costs and reported hours can then be compared against the approved reference even if the current plan changes later.
Can Starbrix show costs that have been ordered but are not yet in accounting?
Yes. Purchase orders can provide an Ordered layer between Estimated and Actual, giving the project manager visibility into committed expenditure before the final accounting entry arrives.
Does time reporting affect project costs?
It can. Users can have hourly costs, allowing reported time to generate actual labor costs automatically. Organizations can alternatively use payroll or accounting information as the source of labor costs.
Can actual costs come from accounting?
Yes. Starbrix can receive project-related financial information through integrations with accounting systems. Actual costs can also be entered manually.
Can project income be tracked as well as costs?
Yes. Starbrix supports both estimated and actual income. Planned income can be assigned dates or divided into partial payments, while actual income can be recorded manually, generated through invoicing, or received through financial integrations depending on the configured process.
Does Starbrix provide cash flow forecasts?
Yes. Planned project income and expenditure can be connected to dates, allowing Starbrix to generate cash flow forecasts from the underlying project budgets. The forecasts are presented in tables and visual graphs and can be viewed for an individual project, an operational area, or the company as a whole.
Can finances be analyzed across multiple projects?
Yes. Starbrix provides project-finance views across the company project portfolio, operational areas/workspaces, umbrella projects, customers, and a user's own projects. Historical completed projects can also be included.
Final perspective
The biggest mistake when comparing project-finance tools is to compare screenshots of budget dashboards.
A dashboard is only the final presentation layer.
The more important question is where the numbers come from, how early they become visible, and whether they remain connected to the project as reality changes.
If planned work, reported time, materials, services, purchases, invoicing, accounting actuals, and cash flow remain disconnected, somebody eventually has to reconcile them manually.
Starbrix approaches the problem by connecting those elements inside the project model itself. An approved budget can remain preserved as a baseline while the current estimate develops. Purchase orders can reveal financial commitments before they appear in accounting. Actuals can flow back from operational activity or financial systems. And because planned income and costs are connected to time, the same information can provide forward-looking cash flow forecasts from an individual project all the way to an operational area or the entire company.
monday.com provides increasingly structured project and portfolio capabilities while retaining its configurable Work OS approach. Smartsheet Resource Management provides a structured resource- and budget-management model with particularly strong time, expense, reporting, and approval controls.
The meaningful comparison is therefore not simply which platform can display a budget.
It is how continuously the financial picture reflects what was approved, what is currently expected, what has already been committed, what has actually happened, and what is expected to happen next.